Orion Tech Operator Operator Status Analysis Dashboard
made with Python, D3.js, & Flask
Executive Summary of Operator Analytics Dashboard
This portfolio piece presents a sophisticated operator analytics dashboard, designed for Orion Technologies, that transforms complex audit and certification data into actionable business intelligence. The project demonstrates expertise in building end-to-end data solutions—ingesting, processing, and visualizing operator and vehicle data to empower decision-makers at every level. The dashboard delivers a comprehensive, interactive view of operator status, progress, and risk, enabling stakeholders to monitor workforce readiness, identify bottlenecks, and drive operational improvements. With its blend of real-time analytics, historical trend tracking, and user-friendly design, this project exemplifies advanced skills in data visualization, web development, and the translation of raw data into meaningful business insights.
Key Standout Features
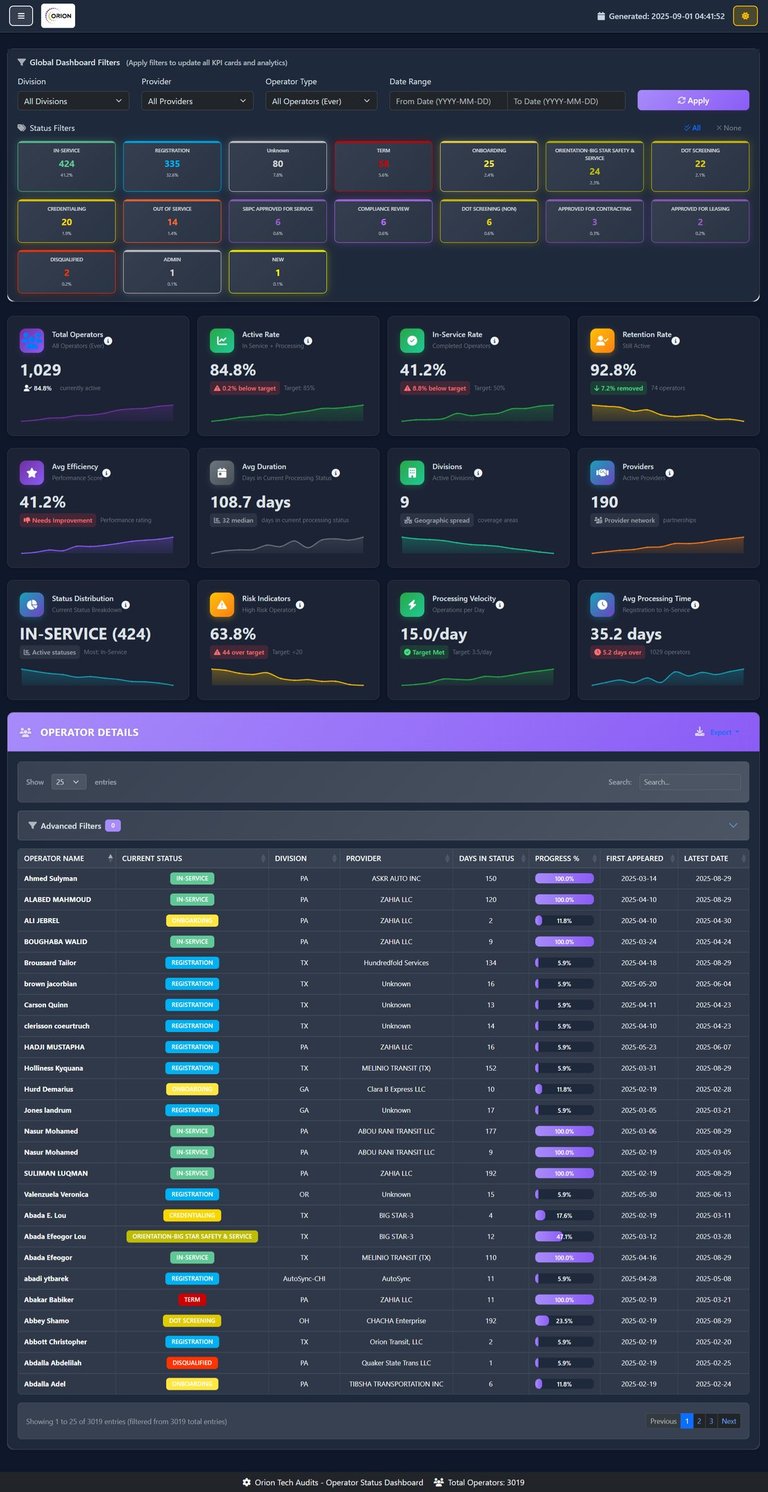
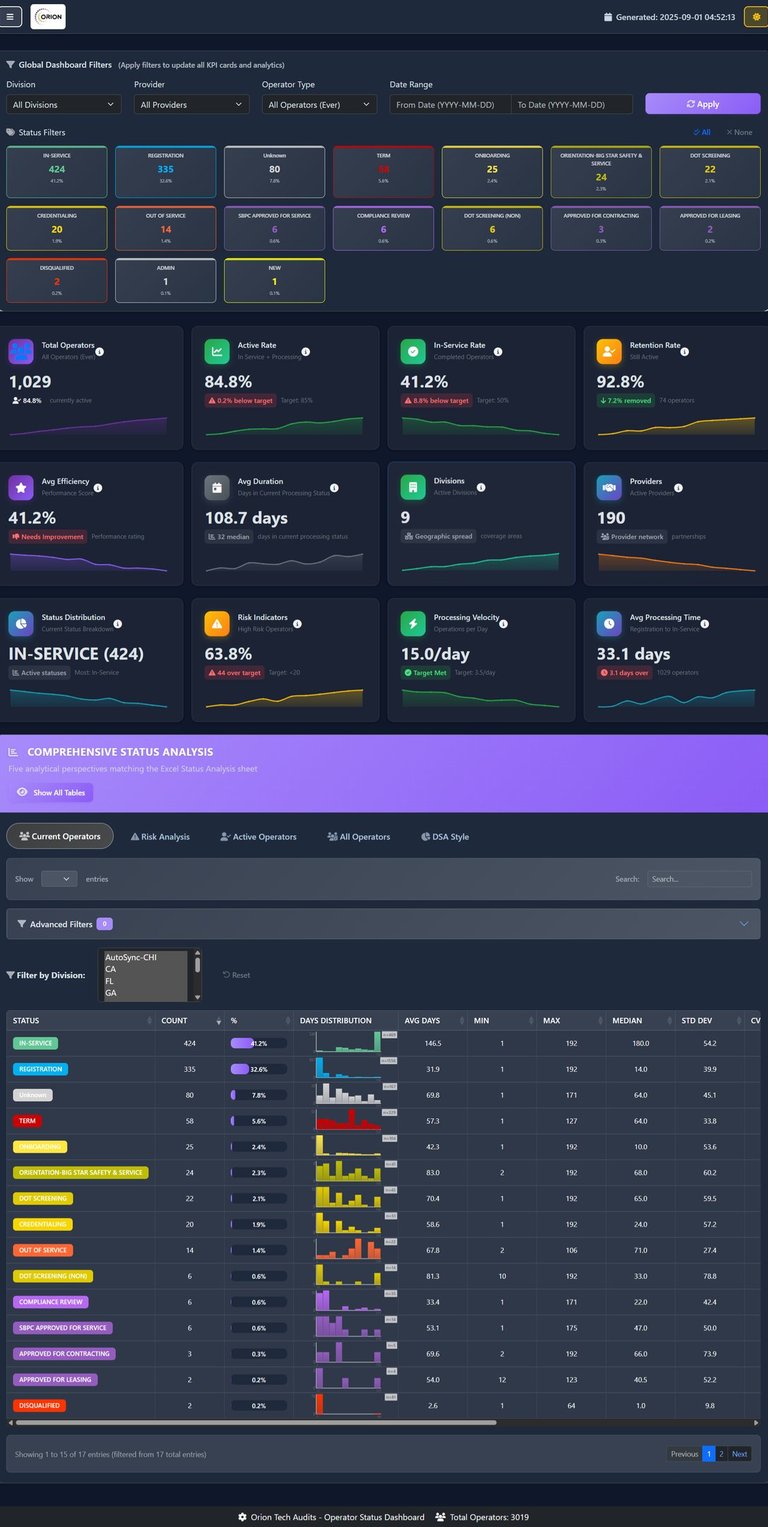
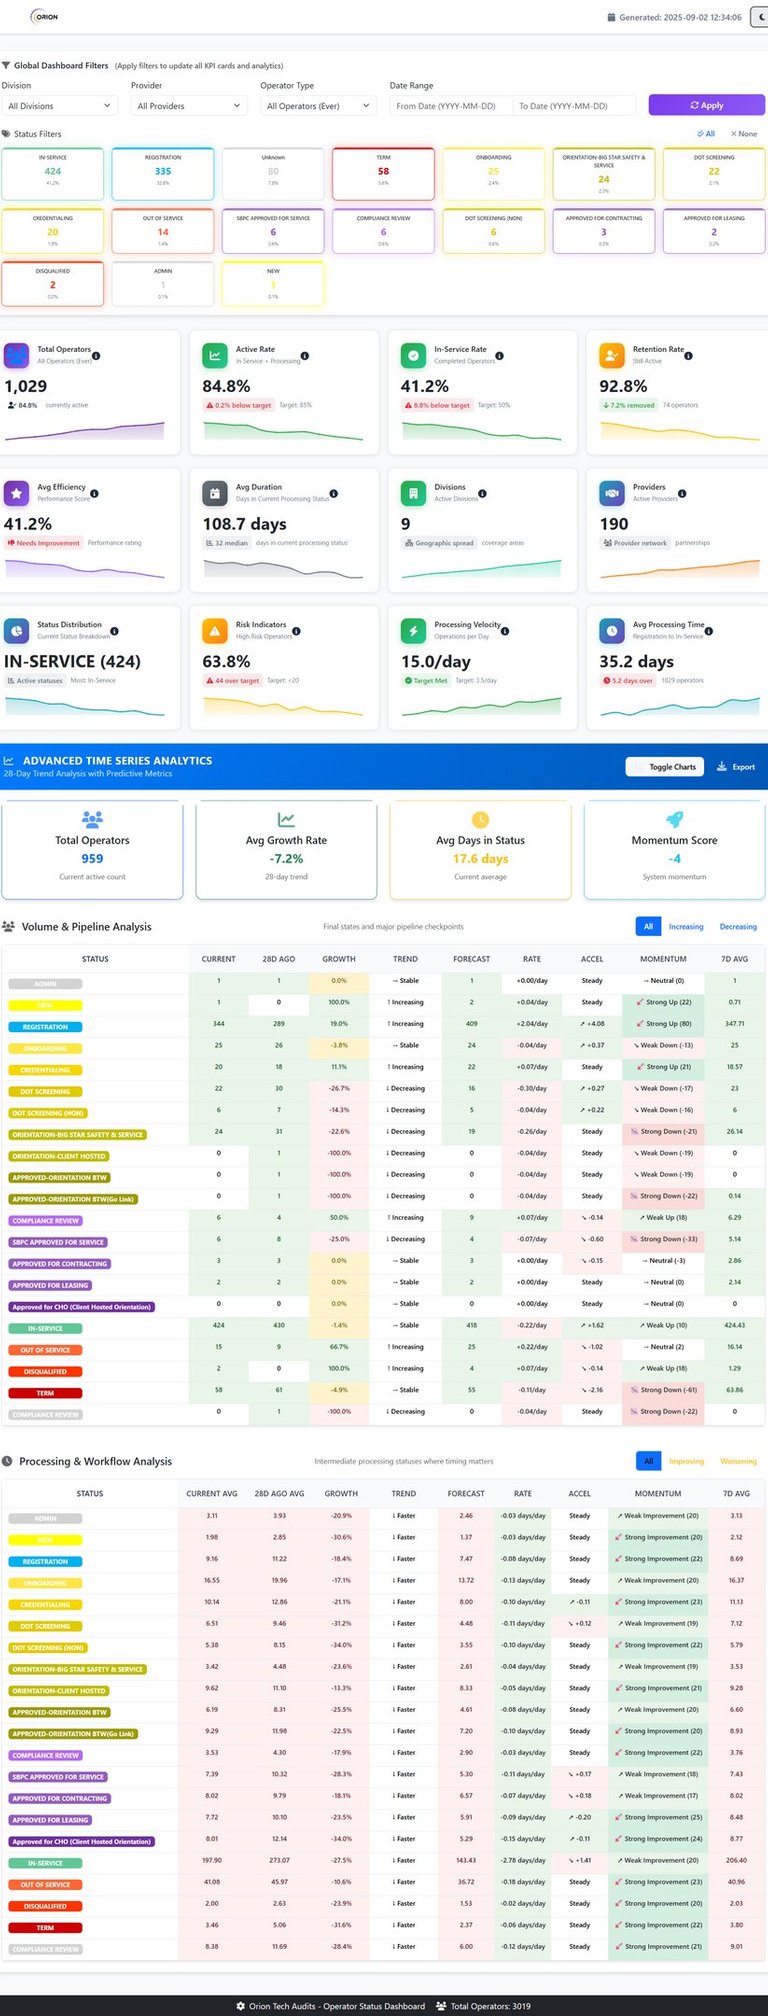
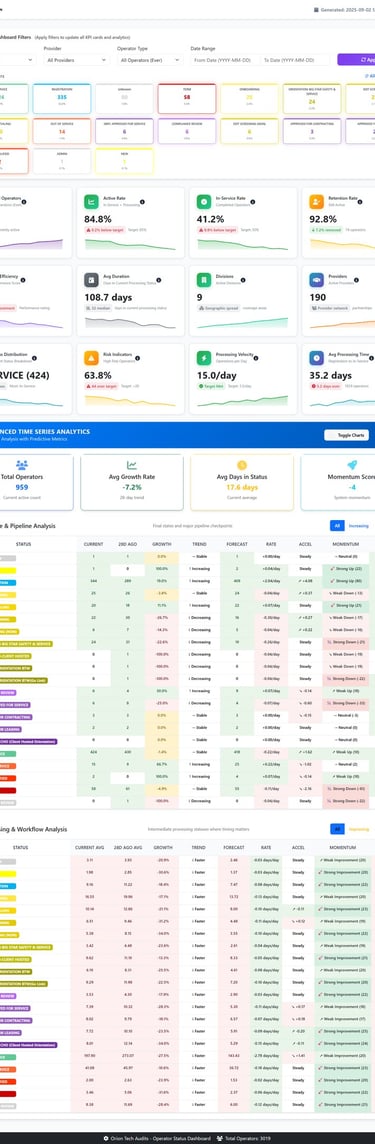
Actionable KPIs: The dashboard highlights critical metrics such as operator in-service rates, status distributions, and risk indicators, ensuring that users can quickly assess workforce health and compliance.
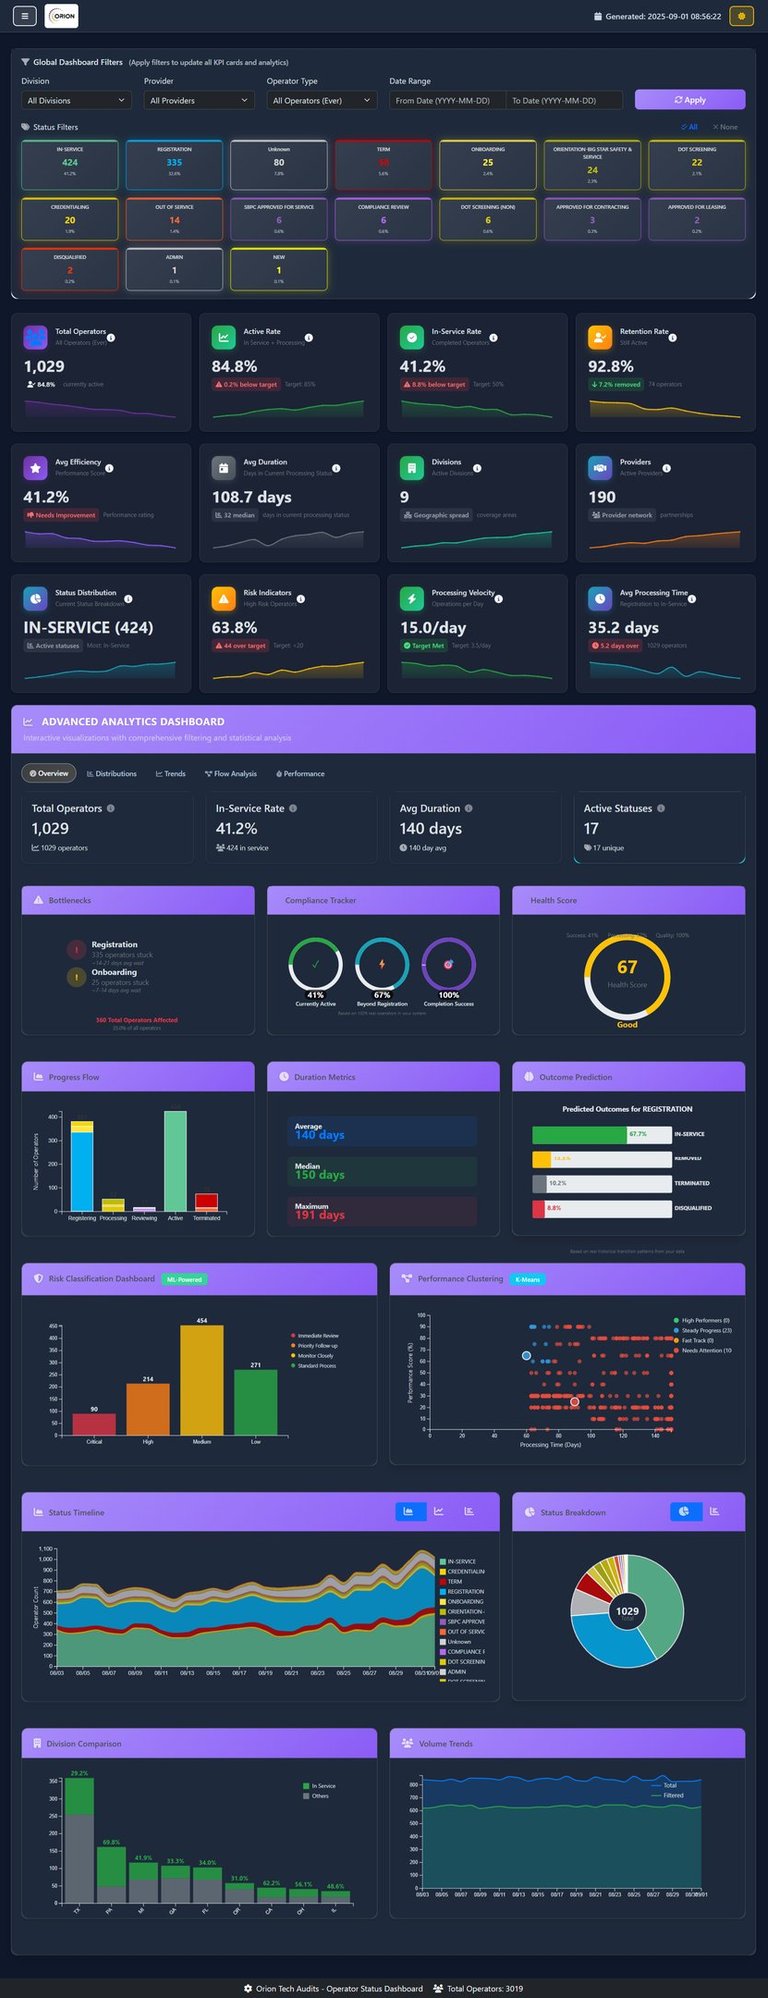
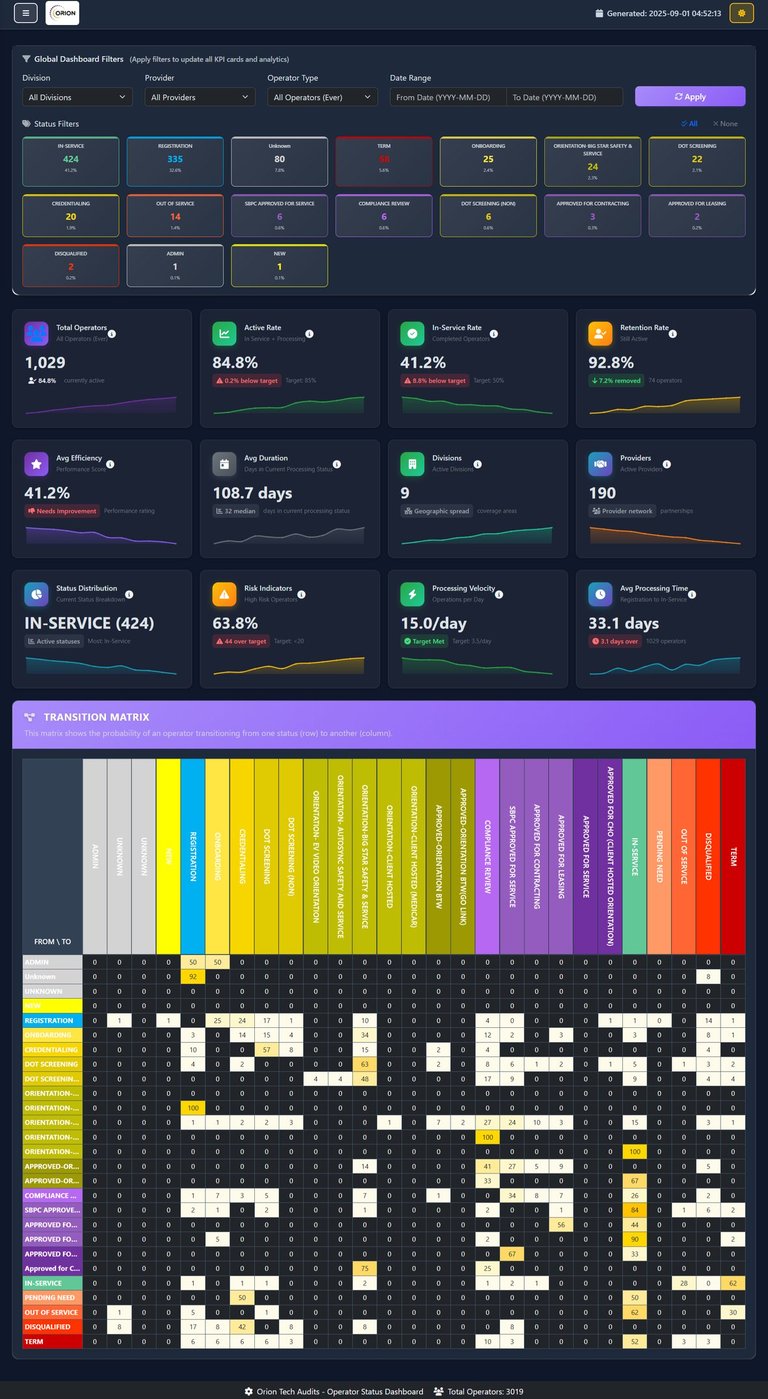
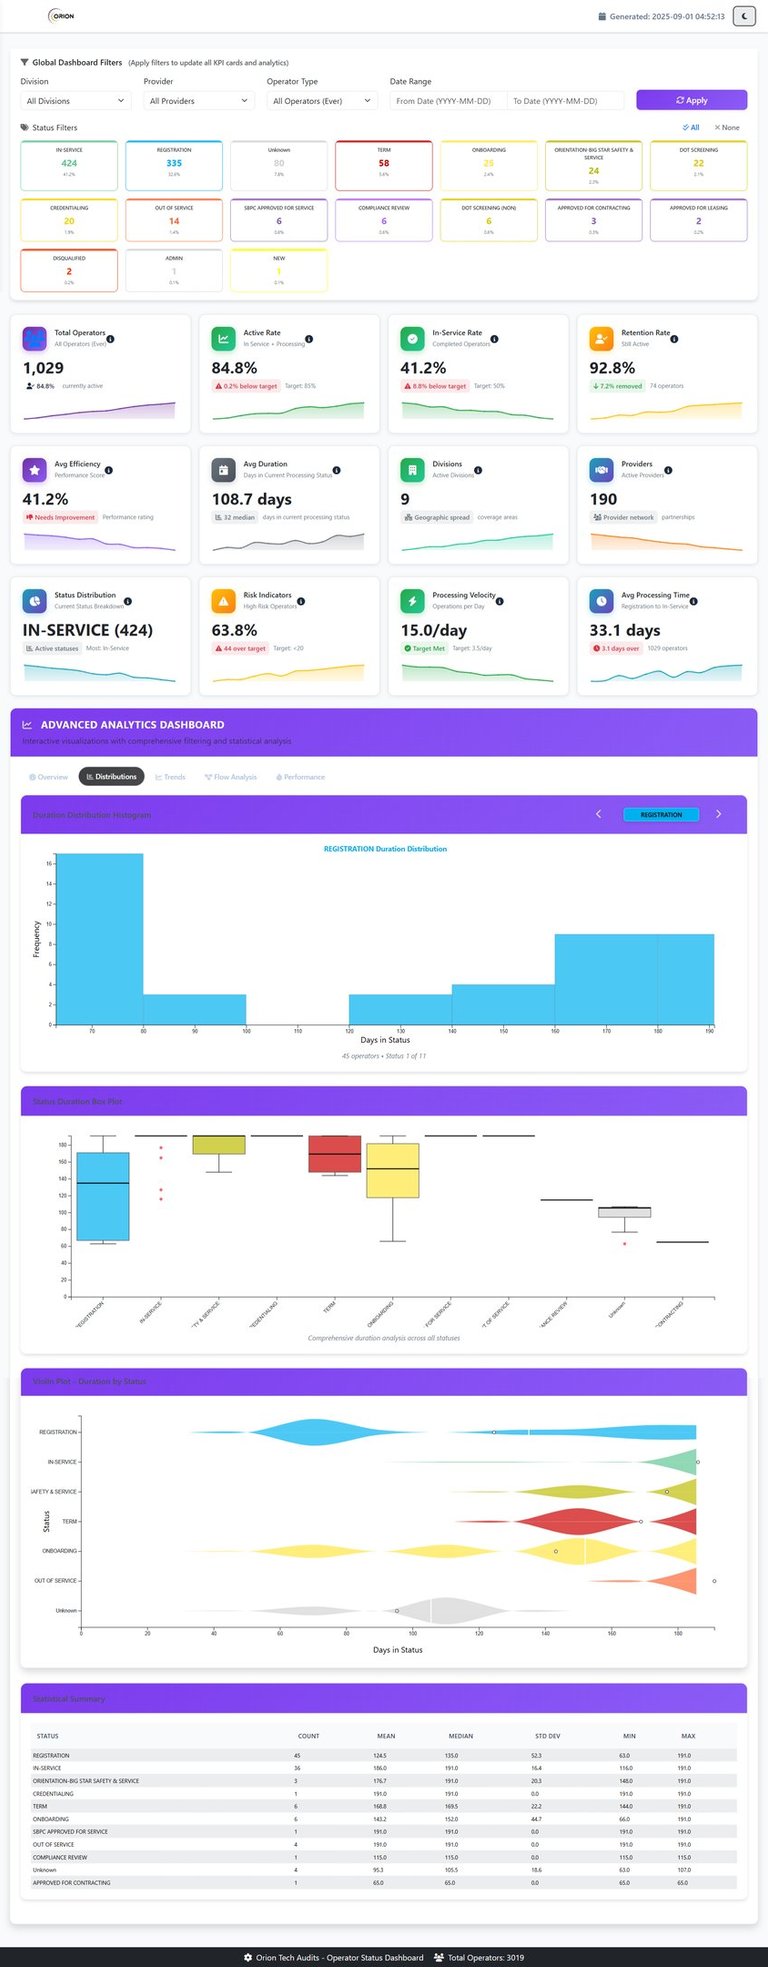
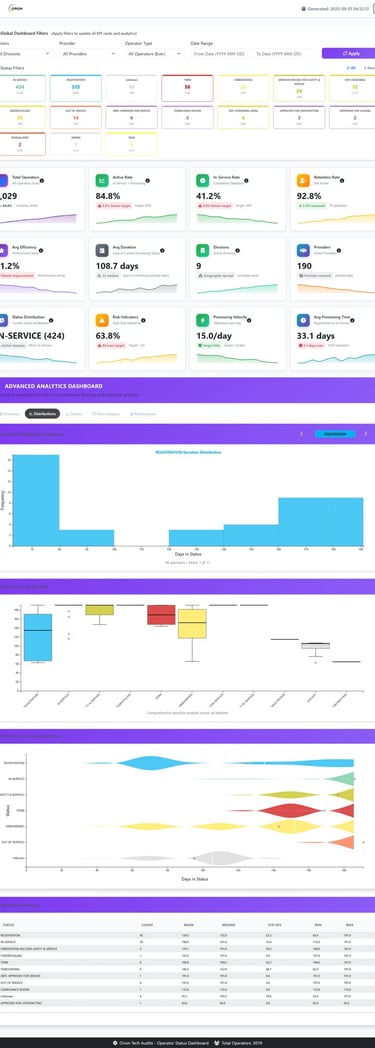
Advanced Analytical Capabilities: Beyond basic reporting, the system provides deep-dive analytics—tracking operator journeys, status transitions, and historical trends. It supports granular breakdowns by division, provider, and status, uncovering patterns and opportunities for process optimization.
Interactive User Experience: Customizable filters and smart tables allow users to explore data by date, division, provider, and status. The web interface is designed for both high-level overviews and detailed drill-downs, making it practical for executives and operational managers alike.
Comprehensive Data Visualization: A variety of charts, tables, and progress indicators are used to communicate complex information clearly. The dashboard leverages modern web technologies (Flask, Jinja2, DataTables.js) to deliver a visually engaging and informative experience.
Problem-Solving Focus: Features such as risk analysis, status duration tracking, and operator progression metrics help proactively identify bottlenecks and at-risk operators, positioning the dashboard as a tool for continuous improvement.
Real-World Applicability: The solution is tailored to the real operational needs of audit and compliance teams, demonstrating the ability to apply technical skills to solve industry-specific challenges and deliver tangible business value.
This project stands as a testament to my ability to architect, develop, and deliver data-driven web applications that turn complex datasets into clear, actionable insights for business stakeholders.
Get in Touch
Contact us to discuss your analytics dashboard needs.


Contact
Connect
coreyleebass1990@gmail.com
+1-815-420-6660
© 2025. All rights reserved.