Company XYZ Product Sales (Purdue Global Assignment)
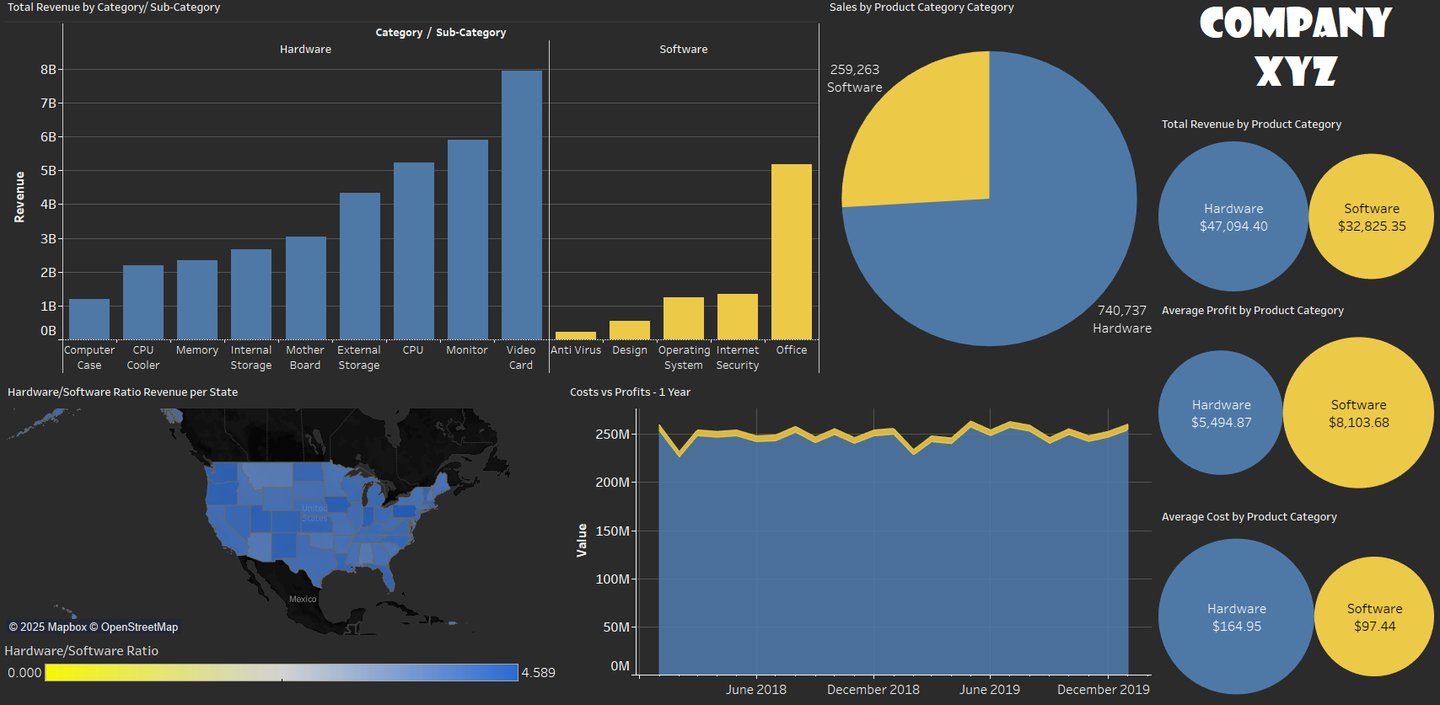
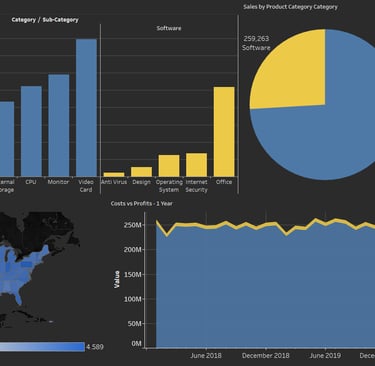
made with Tableau
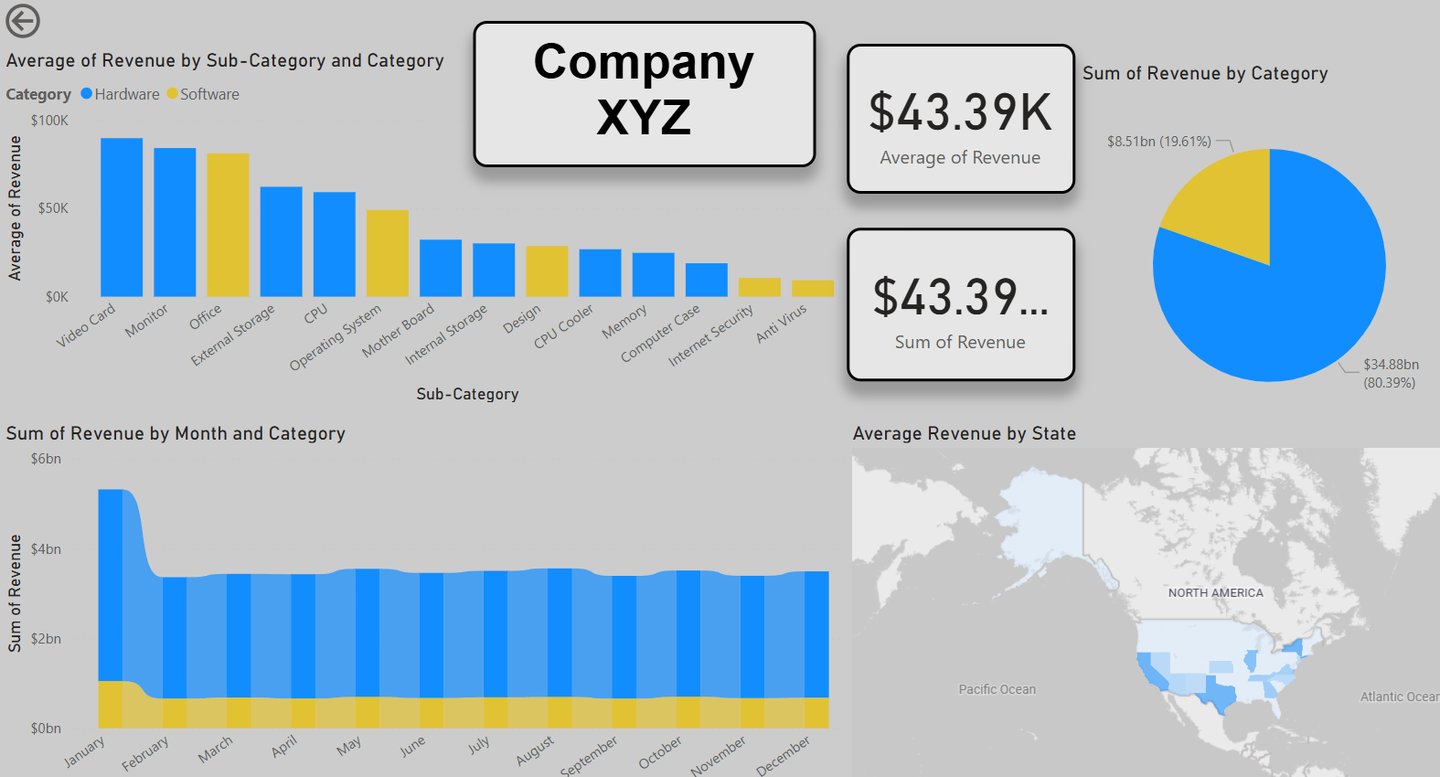
made with PowerBI
Executive Summary of Data Visualization Projects
This portfolio piece showcases my proficiency in data visualization through two distinct dashboards created for a university assignment. By learning both Power BI and Tableau, these projects demonstrate my ability to choose the right tool for a specific purpose and to translate complex data into insightful and actionable visualizations. This work highlights my foundational skills in business intelligence, data storytelling, and the practical application of visualization principles.
Key Standout Features
Versatility in Tool Usage: The projects highlight my ability to effectively use two of the most prominent data visualization tools in the industry. This demonstrates my adaptability and my understanding of when to use a tool for reporting (Power BI) versus when to use it for visual storytelling (Tableau).
Communication Through Data: Both dashboards are not just collections of charts, but are designed to convey a clear message and provide a compelling narrative from the data. This shows a strong grasp of data storytelling and the ability to make complex information easy to understand for any audience.
Practical Application of Theory: These projects are a direct application of the skills I gained in my university program. They serve as a testament to my ability to apply theoretical knowledge to solve practical problems and produce high-quality, professional-grade work.
Learning and Growth Mindset: The use of both Power BI and Tableau for a single assignment showcases a passion for continuous learning and a desire to explore different methods and technologies to find the best solution for a given problem. This highlights a proactive and curious approach to data analytics.
Get in Touch
Contact us to discuss your analytics dashboard needs.


Contact
Connect
coreyleebass1990@gmail.com
+1-815-420-6660
© 2025. All rights reserved.